Millions of Users in Thousands of Global Companies
Millions of Users in Thousands of Global Companies
"A must-have tool… There’s really nothing quite like MindManager."
"We were able to work on multiple proposals simultaneously, helped to increase our coverage by more than 40%"
"MindManager allows me to quickly organize my thoughts and then turn those thoughts into action plans."
“helps businesses turn ideas to reality”
100% User Satisfaction 9/10 Score
-FinancesOnline.com
“MindManager… goes well beyond mind mapping to help companies simplify planning and become better aligned”
-CardRates.com
“[Corel] has accelerated the development of MindManager under its wings to advance the state of enterprise mind mapping”
-MindMappingSoftwareBlog.com
What Can You Do With MindManager?
What Can You Do With MindManager?
MindManager is the best way to create Mind Maps that deliver exactly what you need: RESULTS. With a larger feature-set than your average Mind Mapping program, MindManager clearly outperforms the competition. Build flowcharts, concept maps, timelines, diagrams, and visualize your data in any way that you can imagine. The best part? Make your own Mind Maps today at no cost with a free trial.
Brainstorming
Business Meetings
Project Planning
Product Development
Product Launches
Sales Plans
Visualize Data
Org Charts
Project Management
Presentations
Systems Mapping
Forecasting
Flowcharts
Process Management
Sales Processes
Manufacturing Processes
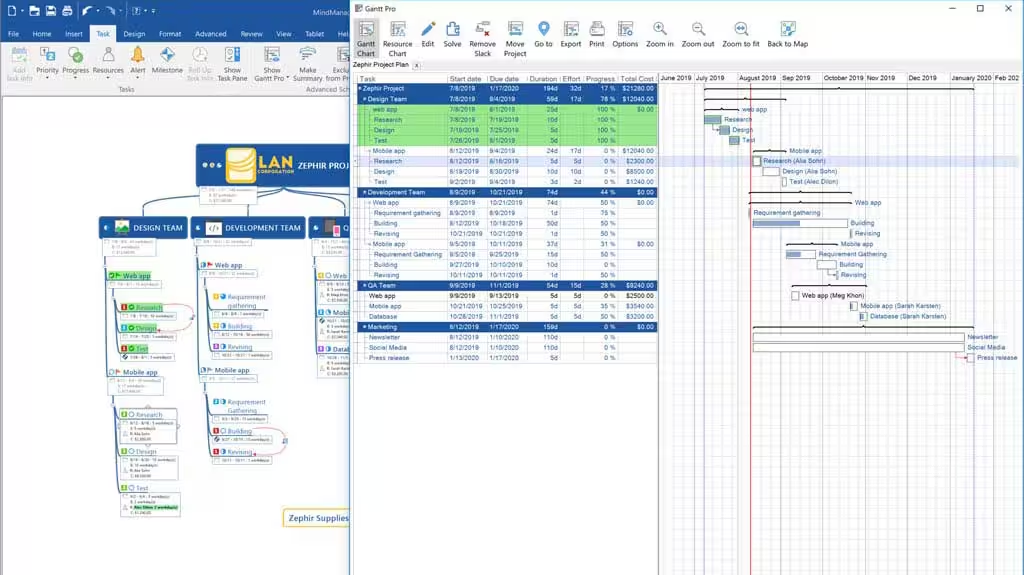
Project Management
Gantt Charts
Timelines
Project Planning
Proposals
Budgeting
An ally for every plan, project, and process
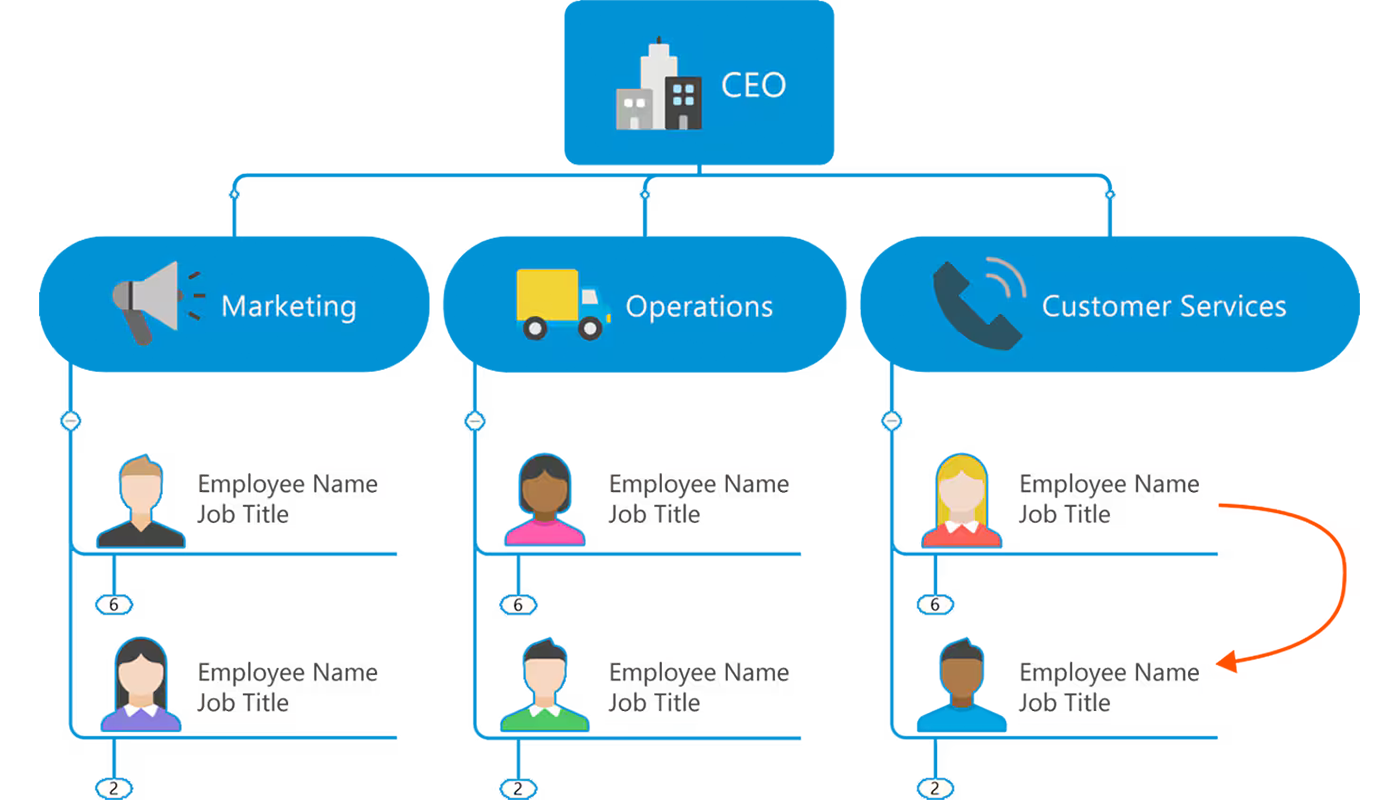
Organizational charts
Simply and easily create a snapshot overview of everyone on your team, on a project, or within an organization. Add images and stylize it just the way you like it.
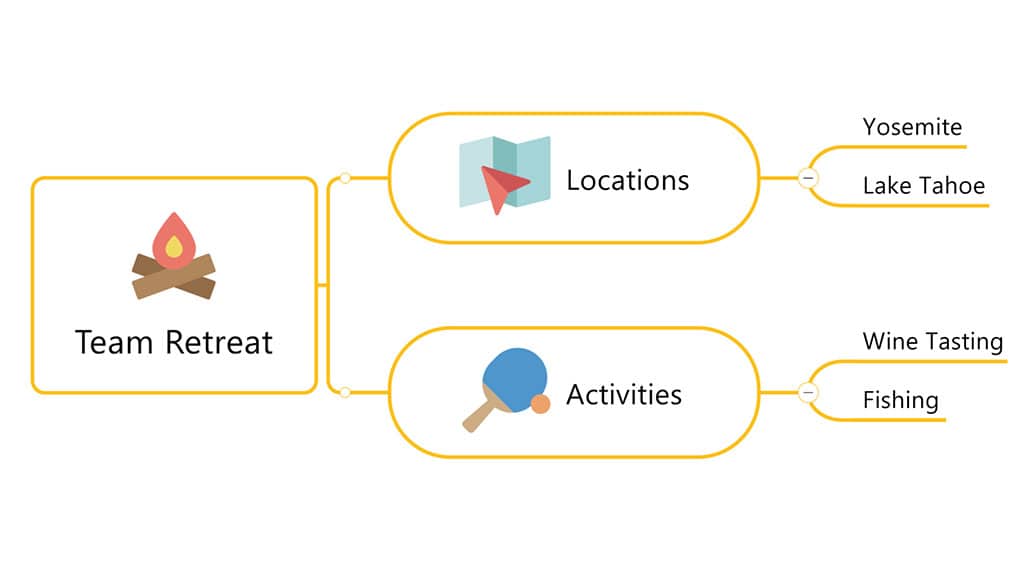
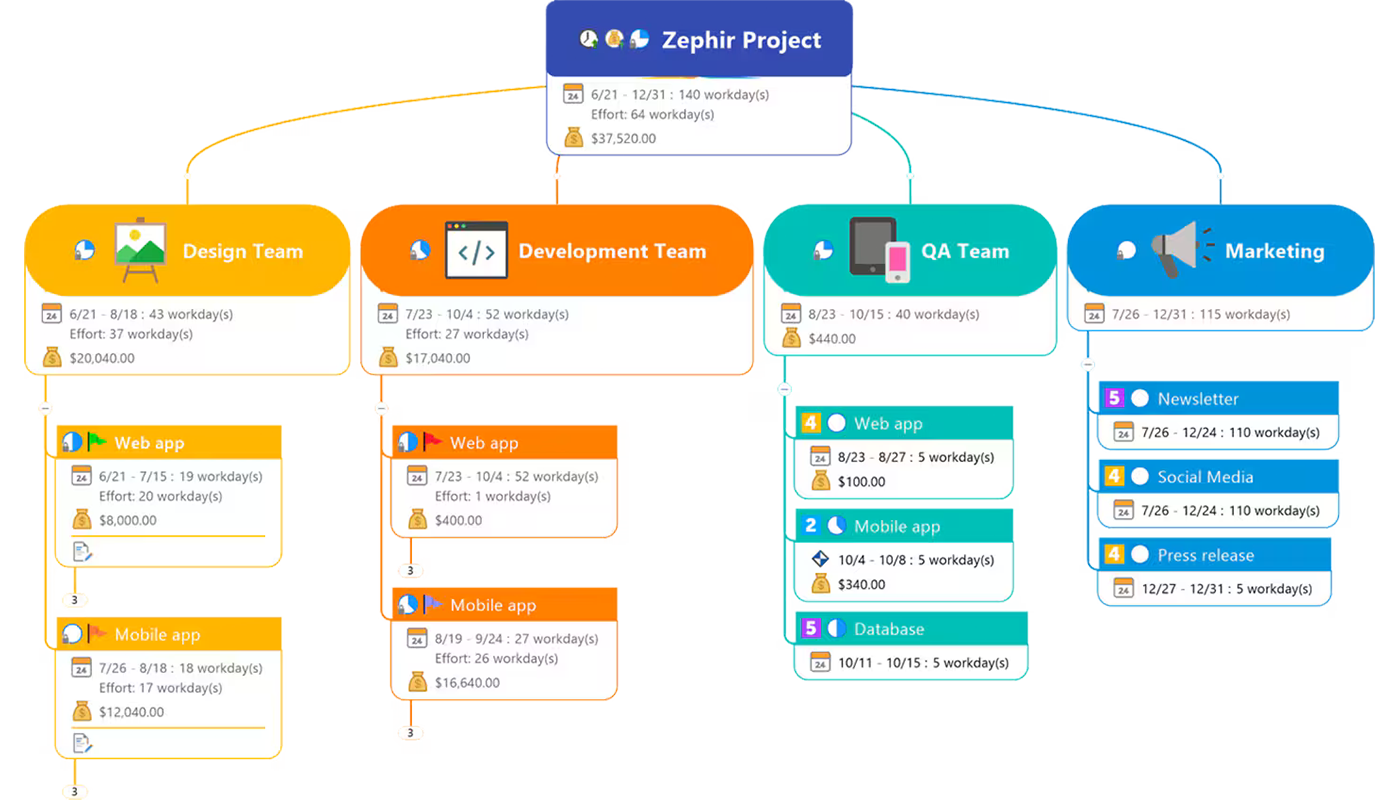
Mind maps
Go from brainstorm to project execution and get your ideas out as quickly as you can think of them. See your projects take shape as you assign resources, costing, and more.
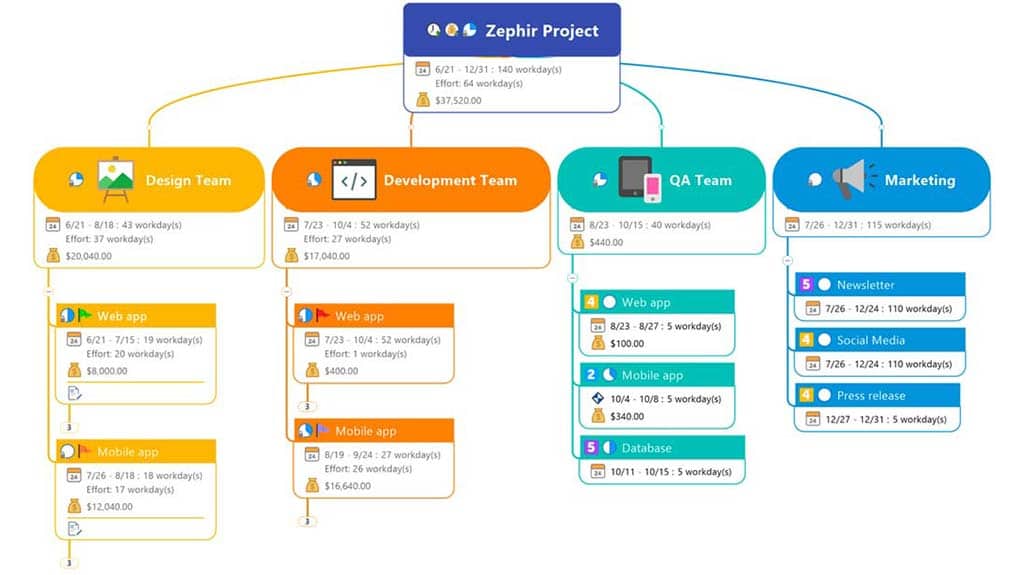
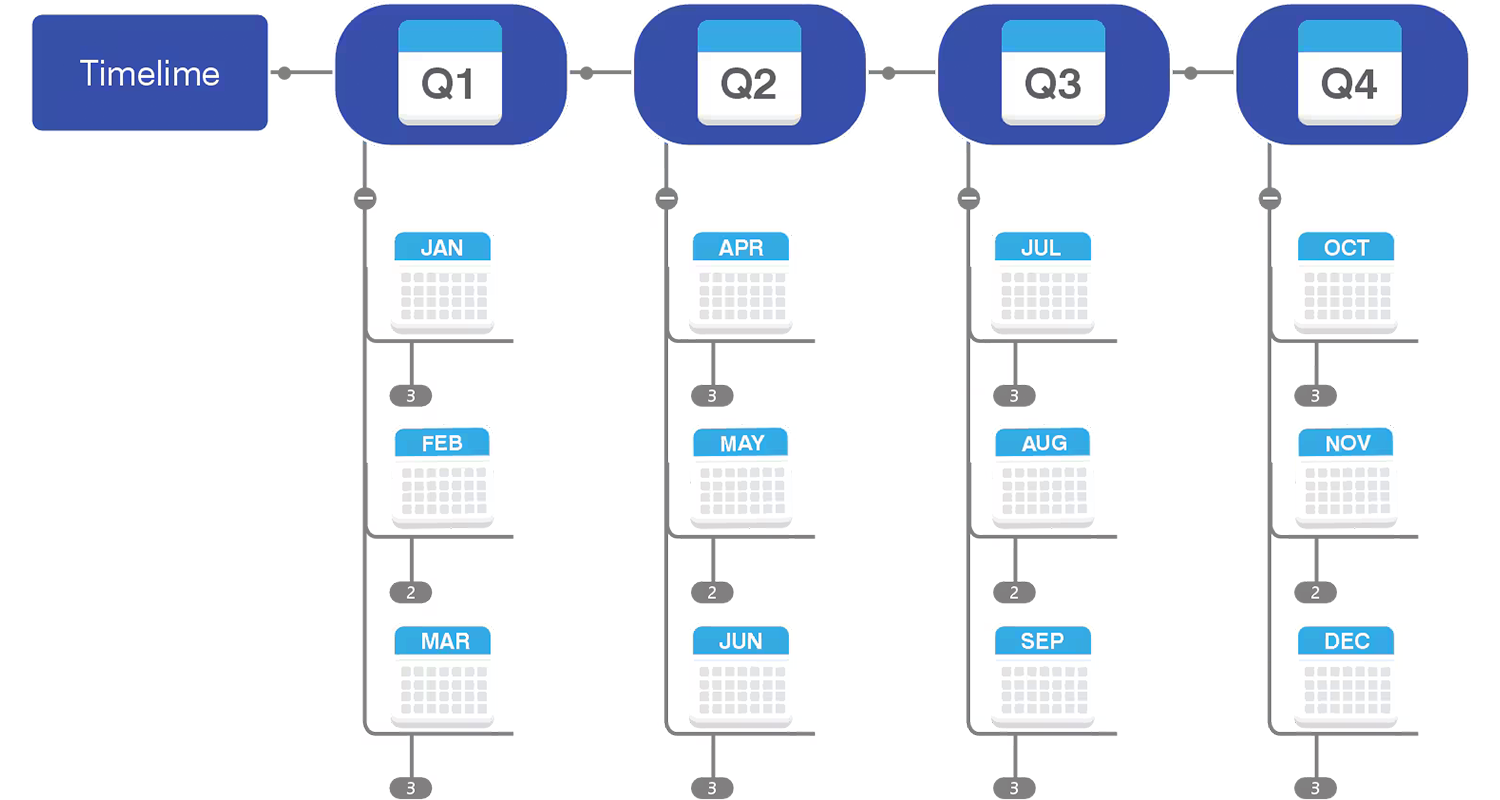
Timelines
Effectively lay out plans, projects, roadmaps, deliverables, and more along a timeline that will give your stakeholders a clear and impressive overview.
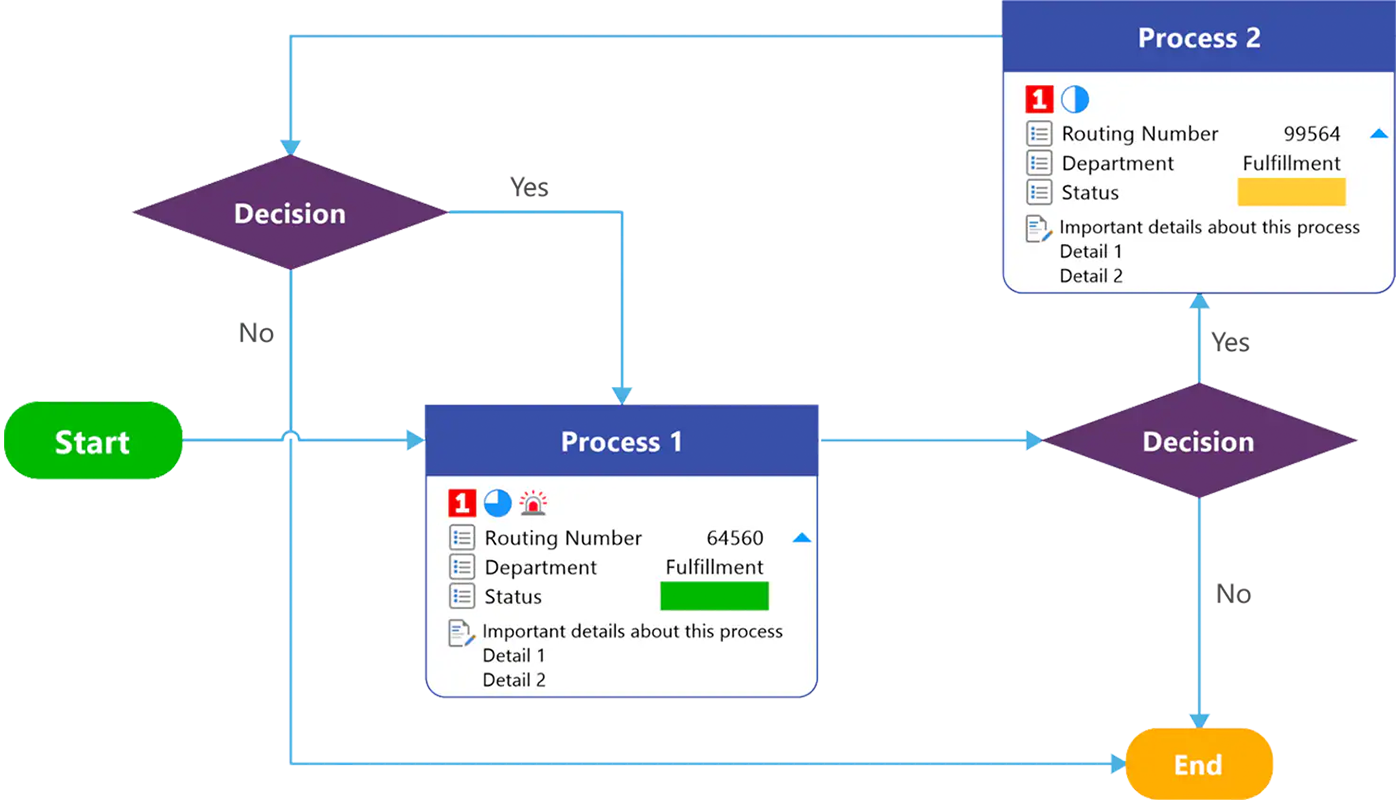
Flowcharts
Chart your path to a better outcome. Create concise, professional flowcharts that help you analyze, design, document, or manage a process or program.
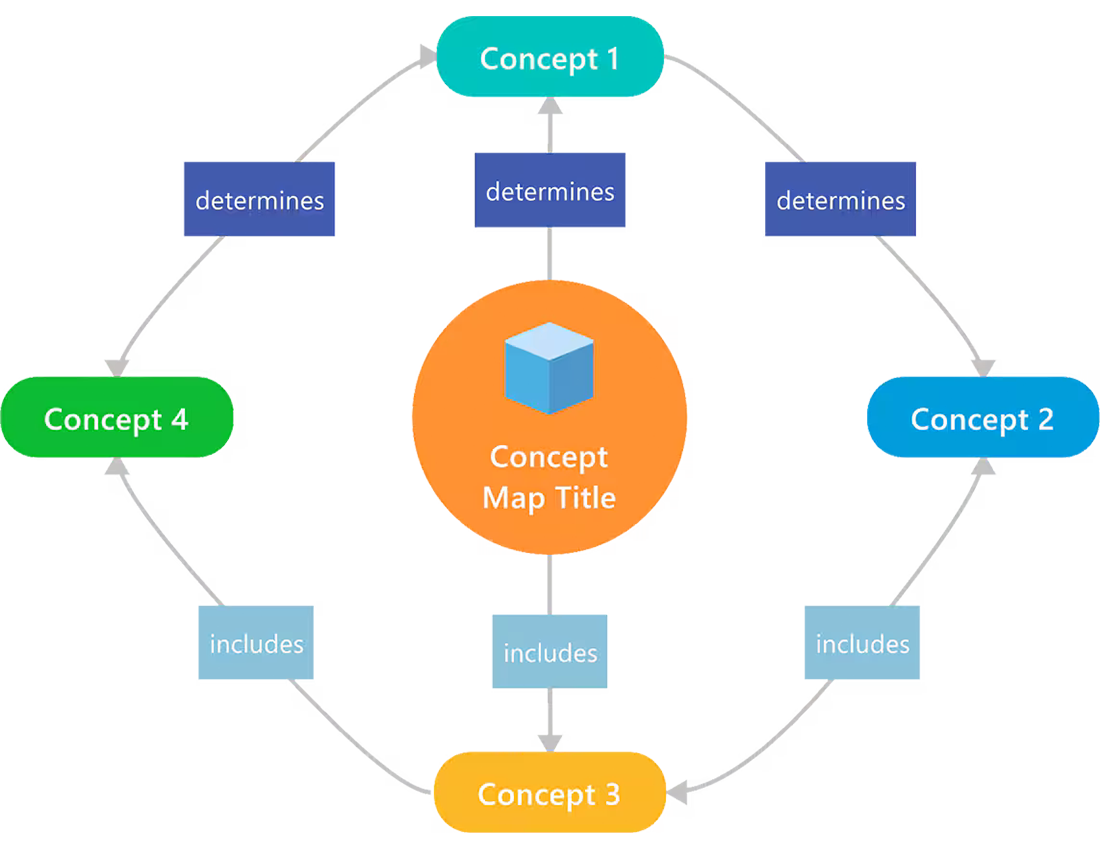
Concept maps
Get a visual representation of relationships between ideas and information that takes your thinking to the next level.
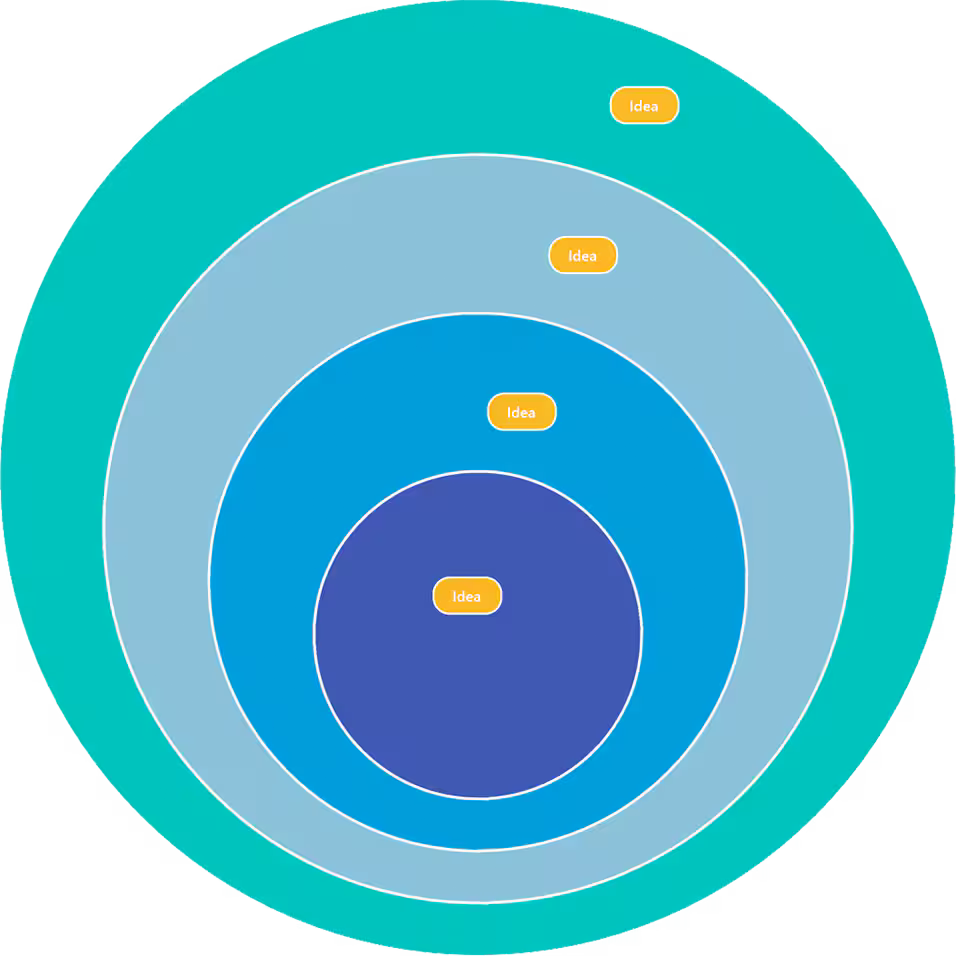
Venn & onion diagrams
See the relationship among sets of items to identify similarities and differences, and visualize the dependencies among parts of an organization or process.
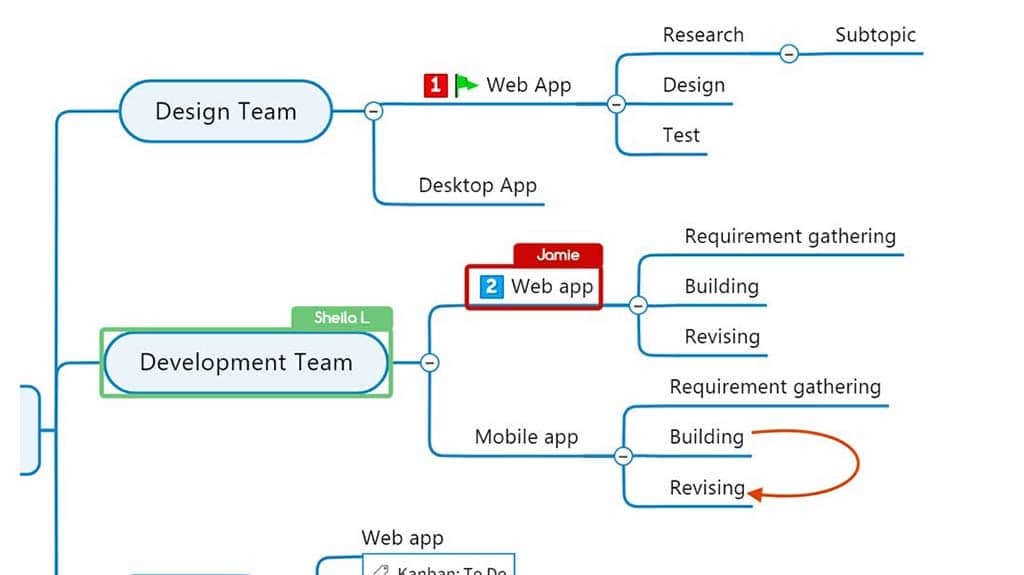
Kanban boards
Kanban boards are an agile project management tool that allow you to visualize work, arrange a team’s workflow, and ensure maximum efficiency of your projects.
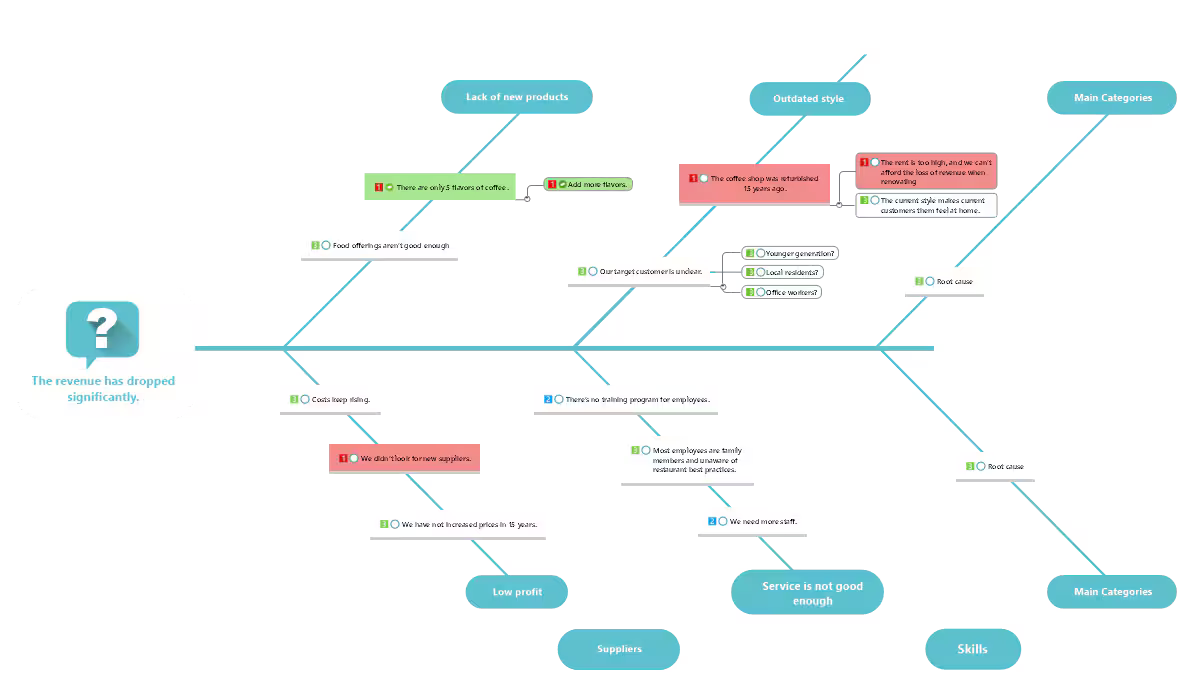
Fishbone diagrams
Also known as Ishikawa diagrams, fishbone diagrams are used in product design and quality defect prevention to help pinpoint potential factors causing an effect.
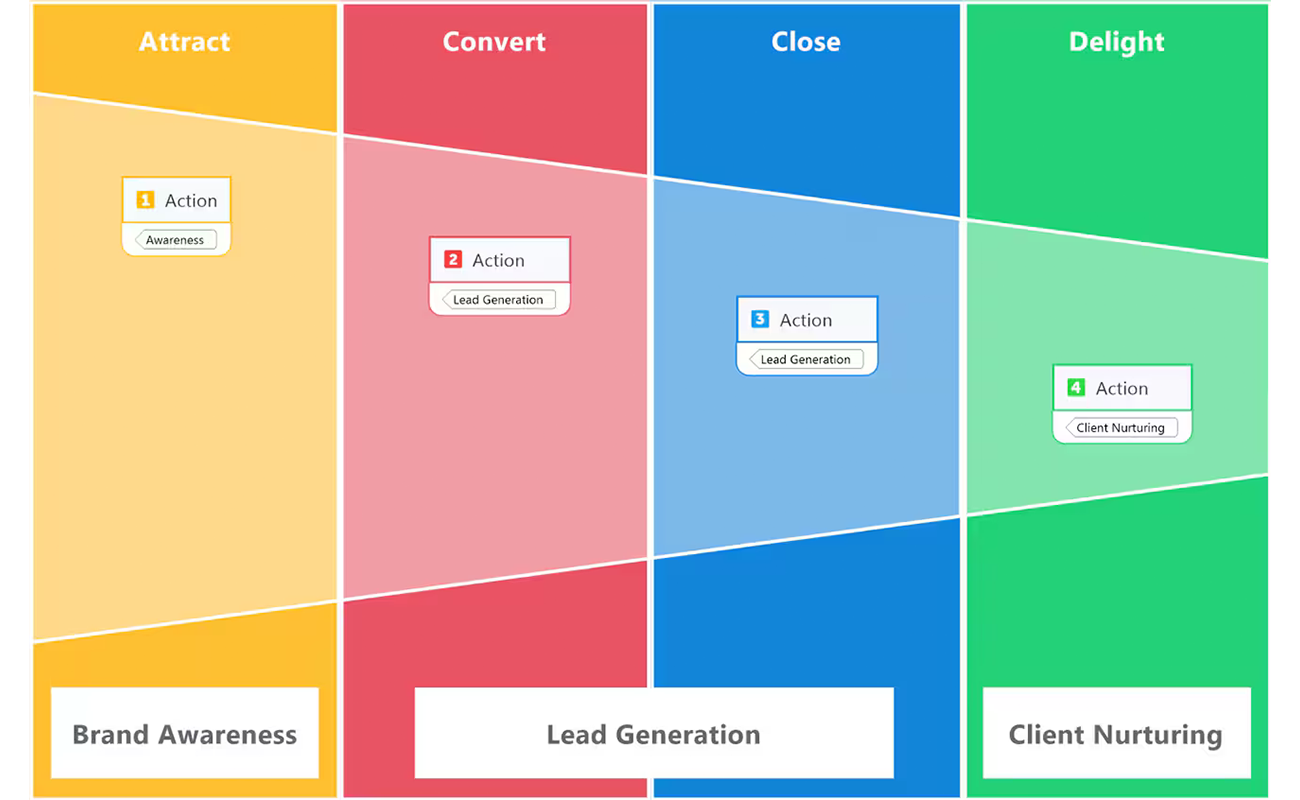
Funnel charts
Get a clear, visual representation of multiple stages in any process that relates to your business. Funnel charts can be used to identify potential problem areas.
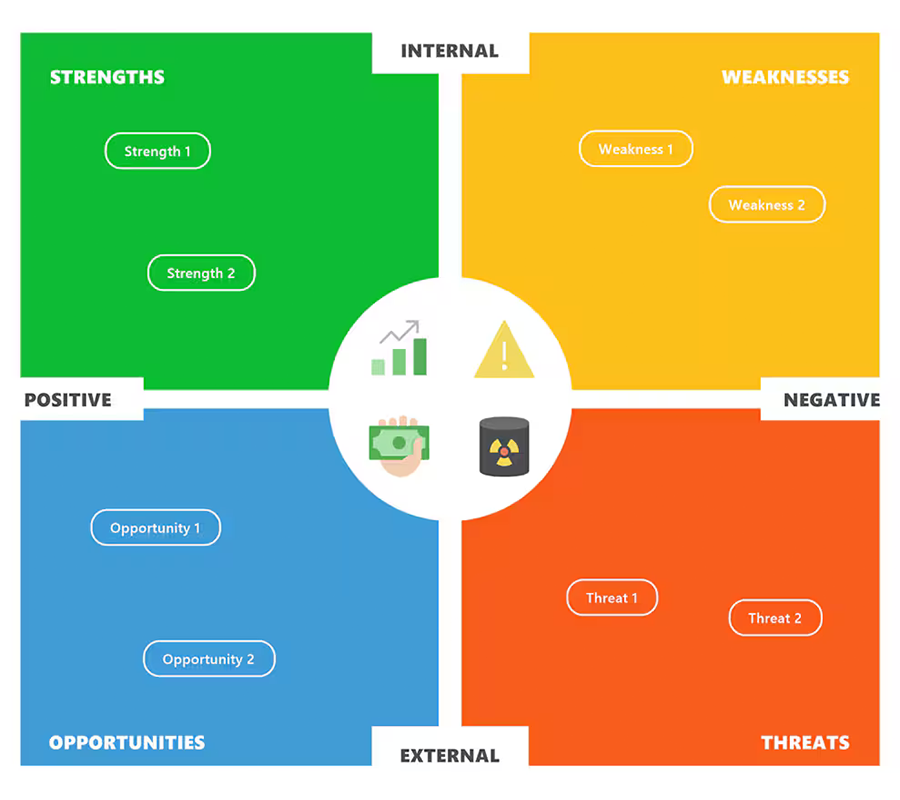
Matrix diagrams
Identify strengths, weaknesses, opportunities, and threats. Matrix diagrams are a great tool to display the relationships between multiple data sets.
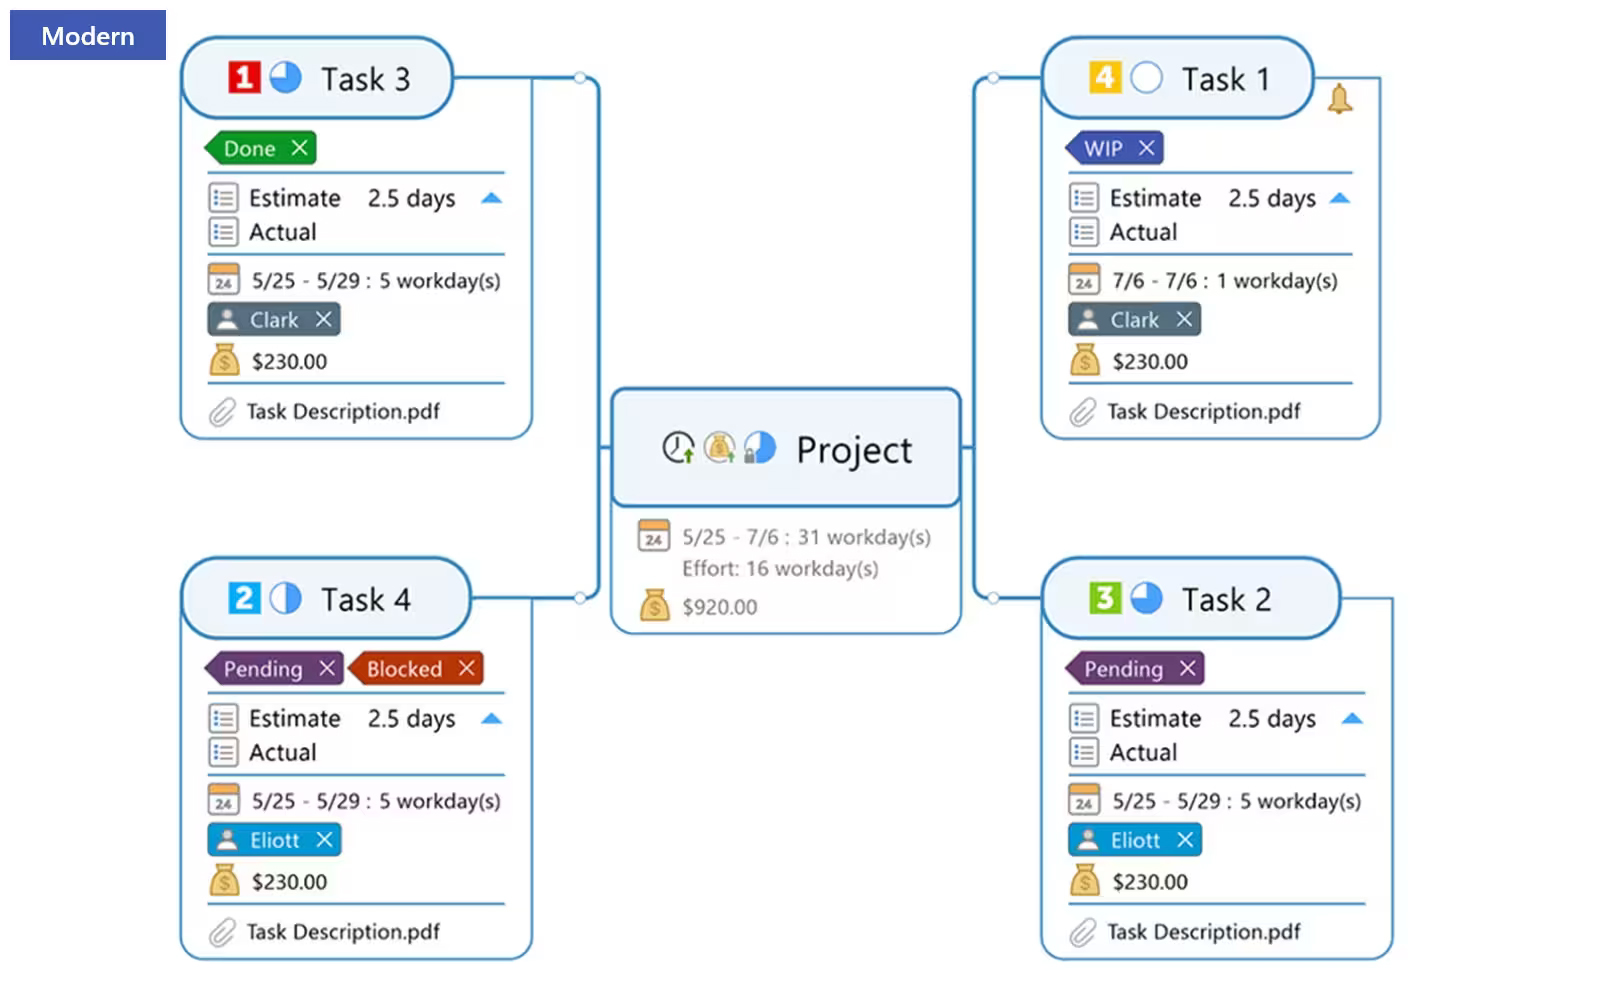
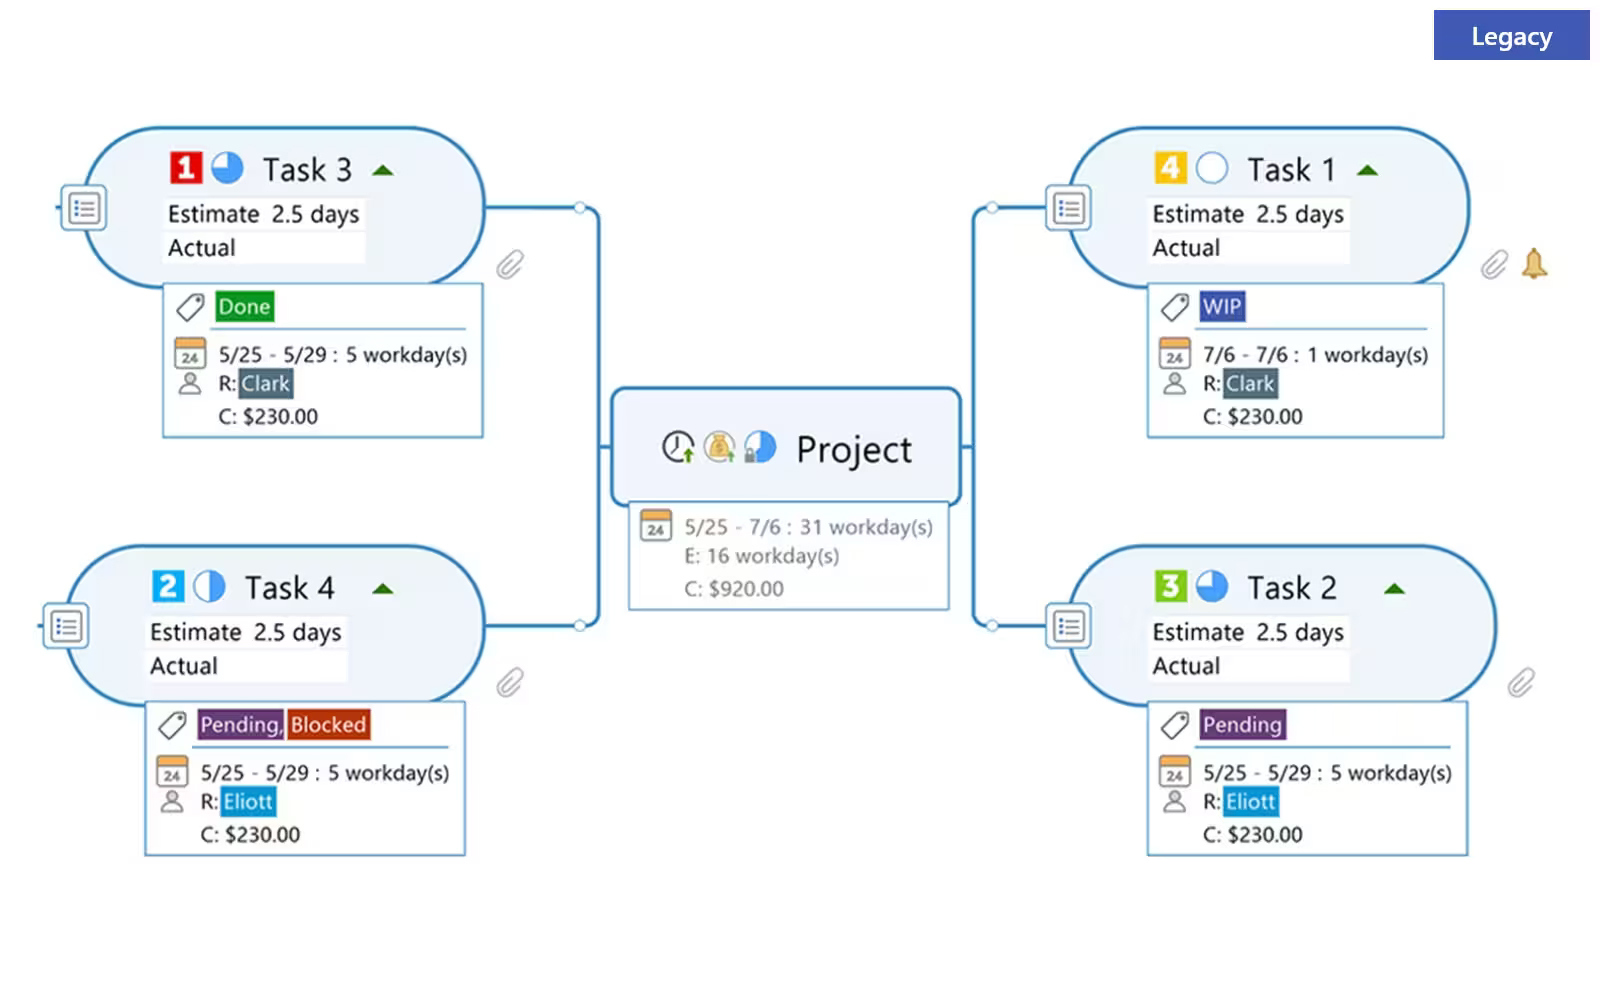
Modern topic info style
Gain greater flexibility over the way your information is displayed. With a fresh new design, the new topic info style is more clear, concise, and customizable.
What Can You Do With MindManager?
Try the full suite of MindManager FREE for 30 days
					/*

Copy this code on section to modify colors of icons, submit button, hovers
depends on the webpage theme.

Note: Keep visibility disabled, Do not Edit this

*/

/*Contact Content Icons & Text*/
.contact-iconbox .elementor-icon {
    color: pink;
    fill: pink;
}
.contact-iconbox .elementor-icon:hover{
    color: violet;
     fill:violet ;
}
.contact-iconbox p a, .contact-iconbox p{
    color: pink !important;
}
.contact-iconbox p a:hover, .contact-iconbox p:hover{
    color: violet !important;
}

/*Contact Form*/
.contact-form .elementor-widget-container{
    background:red !important;
}
.contact-form label{
    color: blue;
}
.contact-form .wpforms-submit-container button{
    border-color: pink !important;
    background: pink !important;
}
.contact-form .wpforms-submit-container button:hover{
    background: violet !important;
    border-color: violet !important;
}
Shopping Basket
Become a Partner
With the ever-changing demands of the industry, we are constantly in search of the right partners to help businesses grow and reach its full potential. Become a partner now! Fill out the form below and we’ll send you the Dealer Application Form.